
REGISTER/LOGIN

ACADEMIC PROJECT, QUESTIONNAIRE RELIABILITY CHECKING, SPSS DATA ANALYSIS, PLAGIARISM CHECKING, BOOK BINDING, BOOKS SALES, E-BOOKS DOWNLOADING, BOOK LAYING AND INDEXING, ISBN BARCODE IMAGE GENERATION, AND BOOK PUBLISHING
OpenBook Sample Size Calculators
(OpenBook Yamane Calculator, OpenBook Cochran Calculator, OpenBook Cochran Correction Calculator and OpenBook Krejcie-Morgan Calculator)
 In order to generalize from a random sample and avoid sampling errors or biases, a random sample needs to be of adequate size. What is adequate depends on several issues which often confuse people doing surveys for the first time. This is because what is important here is not the proportion of the research population that gets sampled, but the absolute size of the sample selected relative to the complexity of the population, the aims of the researcher and the kinds of statistical manipulation that will be used in data analysis (Taherdoost, 2016). While the larger the sample the lesser the likelihood that findings will be biased does hold, diminishing returns can quickly set in when samples get over a specific size which need to be balanced against the researcher’s resources (Gill et al., 2010).
To put it bluntly, larger sample sizes reduce sampling error but at a decreasing rate. Several statistical formulas or calculators are available for determining sample size.
For any of the formulas or calculators, the value between 384 and 400 is the maximum required sample size. The formula converges to this number (384 – 400) for very large population when the standard assumptions (assumed confidence level of 95% with corresponding chi-square [x²] or z-score [z] value of 3.841/1.96, assumed margin of error [e] of 5% and assumed population proportion [p] of 0.5) are applied. The formula is designed to ensure a sufficient sample size even the population is considered infinite.
As the total population size (N) increases, the mathematical contribution of the population size on the required sample size diminishes. When N reaches a certain point at exactly 222,640 (for Cochran Correction/K & M) or 319,601 (for Taro), the finite population correction in the formula of Cochran (1977) as it’s also applied to Krejcie and Morgan (1970), and Taro Yamane (1967) makes a negligible difference, and the calculated sample size effective caps at 384 or 400.
Citations:
Cochran, W.G. (1977) Sampling Techniques. 3rd Edition, John Wiley & Sons, New York.
Gill, J. Johnson, P. & Clark, M. (2010). Research Methods for Managers. Sage Publications
Krejcie, R. V., & Morgan, D. W. (1970). Determining Sample Size for Research Activities. Educational and Psychological Measurement, 30(3), 607–610
Taherdoost, H. (2016). Sampling Methods in Research Methodology; How to Choose a Sampling Technique for Research. International Journal of Advance Research in Management, 5(2), 18-27
Yamane, Taro. (1967). Statistics: An Introductory Analysis, 2nd Edition, New York: Harper and Row.
OpenBook Yamane Calculator, 2022 (OY Calculator, 2022)
 OpenBook Yamane Calculator (OY Calculator, 2022) is a free online sample size calculator developed to help research students or other researchers from various fields worldwide, having problem in calculation using Taro Yamane Formula manually, determine sample size accurately without manipulation.
Taro Yamane (1967) Formula is written as
n = N / (1 + Ne2) simplified and adjusted, to be more accurate, from Cochran’s (1963, 1975) Sample Size Formula:

Where:
- n = Number of Samples,
- N = Total Population,
- e = Error Tolerance (level) or Margin of Error, 0.05
- p = Sample Proportion, 0.5
- z = z-value found in Z-score Table, 1.96
The table below is Z-score Table for most use confidence level or confidence interval.
| Confidence Level | Confidence Interval | Area between zero and z-score | Z-score |
| 90% | 0.10 | 90/2%=0.4500 | 1.65 |
| 95% | 0.05 | 95/2%=0.4750 | 1.96 |
| 99% | 0.01 | 99/2%=0.4950 | 2.58 |
By substituting for z = 1.96 and p = 0.5 in the simplified formula above, Taro Yamane Formula can be proved as follows:

e could be 0.10, 0.05 or 0.01. They are margin of errors, that can be tolerated in determining sample size, at confidence level of 90%, 95% and 99% respectively. They are used in educational and social science research studies. The most commonly and widely used is 0.05. The sample proportion p, though varies, but by default is 0.5. If you are not familiar with confidence level, confidence interval or margin of error and sample proportion – the common terms in sample size and calculation, you can click here.
One of the advantages of using OpenBook Yamane Calculator, to accurately determine sample size, is when the total population is relatively large. Secondly, you don’t need to crack your brain of any complex formula and all its variables’ values especially if you don’t have relevant knowledge in statistics. Other advantage is that as large sample size reduces sampling error to validate research findings, there are always excess samples of 16 or 15 at total population of 300,000 and above, when compared with other Sample Size Calculators, which is enough to gather much more information or data, from the respondents, about a study. To prove this, the highest sample you would ever get using OpenBook Yamane Calculator from total population of 300,000 and above is 400 and the highest sample you would ever get using other Sample Size Calculators from also 300,000 total population and above is 384 or 385. So, there are always excess samples of 16 or 15 to get much more information about a study using OpenBook Yamane Calculator.
However, the population N is to be determined first from the study area. When the population is relatively large and the exact number is unknown, then 300,000 or more can be used because any sample size gotten cannot be greater than 400 or 385 (either Taro Yamane Formula at confidence interval of 0.05 or other Sample Size Formula at confidence level of 95%, confidence interval of 5% and sample proportion of 50%).
Citations:
Cochran, W.G. (1963) Sampling Techniques. 2nd Edition, John Wiley & Sons, New York.
Yamane, Taro. (1967). Statistics: An Introductory Analysis, 2nd Edition, New York: Harper and Row.
To calculate the Sample Size n, using OY Calculator below: enter the Total Population N, then calculate by clicking on Calculate Button. To enter different Total Population N, click Reset Button.
Using OY Calculator, you may also change the default 0.05 in the margin of error e placeholder to your desired confidence interval by selecting either 0.10 or 0.01 as alternate scenario. The 300,000 in the right field of population N placeholder is to be used when the exact number is unknown at confidence interval of 0.05. The common usage of 0.05 confidence interval for a specific sample size result is to bring balance against the researcher’s resources relative to the complexity of the population. Statistically, large samples must be equal to or greater than 30 (Murray, 2009). As sample size is used to validate research findings, it must not be too small. If too small, it will not yield valid results. At the same time, if it’s too large, may be a waste of money and time.
Murray, R. Spiegel et al (2009). Probability and Statistics. The McGraw-Hill Companies Inc.
 |
The use of OpenBook Yamane Calculator can be referenced in your thesis or dissertation with original source (Yamane, 1967) in APA Forrmat and Online Calculator Tool (OpenBook Yamane Calculator) in APA/Website Format as:
Yamane, Taro. (1967). Statistics: An Introductory Analysis, 2nd Edition, New York: Harper and Row.
OpenBook Yamane Calculator. (2022). OpenBook Sample Size Calculators. OpenBook Communications and Technologies, Nigeria. https://www.openbookpage.com/
OpenBook Cochran Calculator (OC Calculator, 2022) and OpenBook Cochran Correction Calculator (OCC Calculator, 2024)
OpenBook Cochran Calculator, 2022 (OCC Calculator, 2022)
(From Cochran’s Sample Size Formula without Adjustment or Modification of Z-score z, 1.96 at confidence interval or margin error e, 0.05 and sample proportion p, 0.5)
To calculate the Sample Size n, using OC/OCC Calculator below: enter the Total Population N, then calculate by clicking on Calculate Button. To enter different Total Population N, click Reset Button.
Using OC Calculator, you may also change the default 1.96 and 0.05 in their respective placeholder to your desired confidence level of either 90% or 99% by selecting 1.65 or 2.58 and 0.10 or 0.01 respectively as alternate scenarios. The 300,000 in the right field of population N placeholder is to be used when the exact number is unknown at confidence interval of 0.05 and z-score value of 1.96. The common usage of 0.05 confidence interval and 1.96 z-score value for a specific sample size result is to bring balance against the researcher’s resources relative to the complexity of the population. Statistically, large samples must be equal to or greater than 30 (Murray, 2009). As sample size is used to validate research findings, it must not be too small. If too small, it will not yield valid results. At the same time, if it’s too large, may be a waste of money and time.
Murray, R. Spiegel et al (2009). Probability and Statistics. The McGraw-Hill Companies Inc.
 |
OpenBook Cochran Correction Calculator, 2024 (OCC Calculator, 2024)
Sample Size can also be calculated using Cochran Sample Size Formula with the application of FINITE POPULATION CORRECTIONs (FPCs)
Cochran (1963, 1975) developed the equation to yield a representative sample for proportion of large sample.
n0 = z² pq/e²
which is valid where n0 is the sample size, z² is the abscissa of the normal curve that cuts off an area α at the tails (1 – α equals the desired confidence level is 95%), e is the desired level of precision, p is the estimated proportion of an attribute that is present in the population, and q is 1-p. The value for z is found in statistical tables which contain the area under the normal curve.
Finite Population Correction for Proportions (If small population). If the population is small then the sample size can be reduced slightly. This is because a given sample size provides proportionately more information for a small population than for a large population. The sample size (n0) can be adjusted as
n = n0 / [1 + {(n0 – 1) / N}]
where n is the sample size and N is the population size
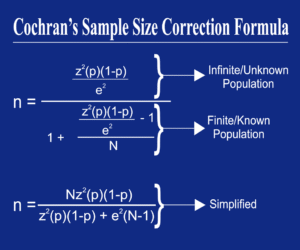
Cochran (1977) introduced Finite Population Corrections (FPCs) based on the sampling fraction f = n/N where n is the sample size and N is the finite population size. In practice, FPCs may be ignored if f does not exceed 5%. Larger samples relative to their populations require FPCs because ignoring large sampling fractions results in biased standard errors (Cochran, 1977). Applied researchers should identify their target populations, examine their sampling fraction, and consider using FPCs because applying FPCs yields more accurate inferences for finite populations.
Citations:
Cochran, W.G. (1963) Sampling Techniques. 2nd Edition, John Wiley & Sons, New York.
Cochran, W.G. (1977) Sampling Techniques. 3rd Edition, John Wiley & Sons, New York.
 |
The use of OpenBook Cochran Calculator can be referenced in your thesis or dissertation with original source (Cochran, 1977) in APA Forrmat and Online Calculator Tool (OpenBook Krejcie-Morgan Calculator) in APA/Website Format as:
Cochran, W.G. (1977) Sampling Techniques. 3rd Edition, John Wiley & Sons, New York.
OpenBook Cochran Calculator. (2024). OpenBook Sample Size Calculators. OpenBook Communications and Technologies, Nigeria. https://www.openbookpage.com/
OpenBook Krejcie-Morgan Calculator (OK-M Calculator, 2024)
(From Krejcie and Morgan Sample Size Formula without Adjustment or Modification of Chi-Square x², 3.841 at confidence interval or margin error e, 0.05 and sample proportion p, 0.5)
Krejcie and Morgan (1970) Formula was introduced as an alternative formula in computing sample size for categorical data. The formula is written as:

Where:
- n = Number of Samples,
- N = Total Population,
- e = Error Tolerance (level) or Margin of Error, 0.05
- p = Sample Proportion, 0.5
- x² = Chi-Square value found in Chi-Square Table, 3.841
The table below is Chi-Square Table for most use confidence level or confidence interval.
| x²0.90 | x²0.95 | x²0.99 | |
| Degree of Freedom | 10% (0.10) | 5% (0.05) | 1% (0.01) |
| 1 | 2.706 | 3.841 | 6.635 |
OpenBook Krejcie-Morgan Calculator can be used as an alternative tool to confirm the cases of population and sample size not listed in Krejcie and Morgan Sample Size Table (1970), a well known table for sample size determination among behavioural and social science researchers. The main advantage of the OpenBook Krejcie-Morgan Sample Size Calculator is providing a quick, simple, and reliable way for researchers to find a representative sample size without complex manual calculations or assumption of sample size not listed in Krejcie and Morgan Sample Size Table (e.g. sample size of the population of 175), especially when dealing with large populations, ensuring resources aren’t wasted on too small or too large samples for accurate, generalizable insights. It standardizes sample selection, saving time and effort, and is particularly useful for educational, social, and market research.
Citation:
Krejcie, R. V., & Morgan, D. W. (1970). Determining Sample Size for Research Activities. Educational and Psychological Measurement, 30(3), 607–610
To calculate the Sample Size n, using OK-M Calculator below: enter the Total Population N, then calculate by clicking on Calculate Button. To enter different Total Population N, click Reset Button.
Using OK-M Calculator, you may also change the default 3.841 and 0.05 in their respective placeholder to your desired confidence level of either 90% or 99% by selecting 2.706 or 6.635 and 0.10 or 0.01 respectively as alternate scenarios. The 300,000 in the right field of population N placeholder is to be used when the exact number is unknown at confidence interval of 0.05 and chi-square x² value of 3.841. The common usage of 0.05 confidence interval and 3.841 chi-square x² value for a specific sample size result is to bring balance against the researcher’s resources relative to the complexity of the population. Statistically, large samples must be equal to or greater than 30 (Murray, 2009). As sample size is used to validate research findings, it must not be too small. If too small, it will not yield valid results. At the same time, if it’s too large, may be a waste of money and time.
Murray, R. Spiegel et al (2009). Probability and Statistics. The McGraw-Hill Companies Inc
 |
The use of OpenBook Krejcie-Morgan Calculator can be referenced in your thesis or dissertation with original source (Krejcie & Morgan, 1970) in APA Forrmat and Online Calculator Tool (OpenBook Krejcie-Morgan Calculator) in APA/Website Format as:
Krejcie, R. V., & Morgan, D. W. (1970). Determining sample size for research activities. Educational and Psychological Measurement, 30(3), 607-610.
OpenBook Krejcie-Morgan Calculator. (2024). OpenBook Sample Size Calculators. OpenBook Communications and Technologies, Nigeria. https://www.openbookpage.com/
Example of Sample Size and Sampling Technique in the Methodology Section of a Research
 The study employed a quantitative research design, utilizing a simple random sampling technique to select participants from the target population. To ensure a statistically representative sample size, the researchers utilized the widely recognized method developed by Krejcie and Morgan (1970) for determining sample sizes for categorical data. Since the exact population figure was not listed in the original Krejcie and Morgan table (1970), the OpenBook Krejcie-Morgan Calculator was used to provide a precise calculation based on the established formula, ensuring accuracy and saving time on manual calculations.
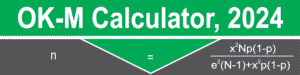
The OpenBook Krejcie-Morgan Calculator uses the following formula to determine the required sample size (n):
n = x2 Np(1 – p)/e2(N – 1) + x2p(1 – p)
Where:
- n = required sample size,
- N = the population size,
- e = the degree of accuracy expressed as a proportion (typically 0.05 for a 5% margin of error),
- p = the population proportion (assumed to be 0.50 to provide the maximum possible sample size,
- x² = table value of chi-square for 1 degree of freedom at the desired confidence level (typically 3.841 for a 95% confidence level)
For this study, the total population (N) was determined to be [insert your population number].
Using the OpenBook Krejcie-Morgan Calculator (2024), with a 95% confidence level (x2 = 3.841), a 0.5 population proportion (p), and a 0.05 margin of error (e), the required sample size was calculated to be [Insert Your Calculated Sample Size] respondents.
Why Should OpenBook Krejcie-Morgan Calculator Be Considered for Academic or Market Research?
 The OpenBook Krejcie-Morgan Sample Size Calculator should be considered for academic or market research because it provides a quick, reliable, and precise method for determining sample sizes, which is an alternative to the widely-used, but sometimes limited, manual tables. The following are the reasons to consider using the calculator:
- Accuracy and Reduced Error: The calculator uses the established Krejcie and Morgan (1970) formula to compute the exact sample size needed for a given population size, which helps minimize calculation errors that can occur during manual calculations.
- Efficiency and Time-Saving: It simplifies the process of determining sample size, allowing researchers to quickly get an optimal number without performing complex manual math, thereby saving valuable time and resources.
- Handling Specific Population Sizes: The original Krejcie and Morgan table lists sample sizes for specific population figures (e.g., 100, 200, etc.). The online calculator, however, can handle any specific population number, providing a precise sample size for cases not listed in the table (e.g., a population of 175 or 1,063).
- Statistical Rigor: The results are based on a statistically sound and well-known formula that is widely accepted in behavioral, social sciences, and market research fields. This ensures the chosen sample size is statistically significant and the findings are more reliable and generalizable to the target population.
- Accessibility: As a free online tool, it benefits a wide range of researchers, including students or those with limited resources, by providing access to reliable sample size determination without requiring specialized statistical software.
- Flexibility and Customization: While the Krejcie and Morgan method typically assumes a 95% confidence level and a 5% margin of error, the OpenBook calculator allows users to adjust the chi-square value and error tolerance for alternate scenarios, such as 90% or 99% confidence levels.
- Standardized Approach: Using a calculator helps standardize the sample selection process, reducing potential bias and enhancing the credibility and transparency of the research methodology.
Ultimately, using the OpenBook Krejcie-Morgan Sample Size Calculator helps ensure the research has an adequate sample size to produce reliable and trustworthy results while streamlining the planning phase of a study.
Gotten Your Sample Size from OY/OC/OK-M Calculator, What’s Next?
Now that you have gotten your sample size, from any of the calculators above, for the number of copies of your questionnaires, to be administered to your respondents, let OpenBook have the Questionnaire Reliability Checking and SPSS Data Analysis done for you. SPSS Data Analysis using Descriptive and Inferential Statistics.

Questionnaire Reliability Checking (Cronbach Alpha) is EXCLUSIVELY FREE! Distance is not a barrier; you can upload your already ticked FORM/QUESTIONNAIRE to whatsapp number: 2348028999115.
Service Price of SSPS Data Analysis ranges from 15,000 to 70,000 in Nigeria Naira (NGN) and 10 to 47 in US Dollar (USD).
BSc/BA Research Data Analysis, Price: NGN15,000/USD10.
MSc/MA Research Data Analysis, Price: NGN30,000/USD20.
PhD Research Data Analysis, Price: NGN70,000/USD47.
To make payment, click this button: OpenBook Online Payment Form
For more information, you can message us through whatsapp number: 2348028999115 or click
![]()
